
Santa's Workshop Dashboard

POWERED BY HOLIDAY CHEER AND MOSER ANALYTICS

Sprinkle, Twinkle and Crinkle were three of Santa’s elves who had been working in the North Pole for many years. They loved their work and enjoyed spreading Christmas cheer to all the children around the world. But lately, with demand for toys increasing every year, they have found that it was getting harder and harder to deliver presents on time.
That was when Santa decided to hire Moser Consulting’s Data and Analytics experts to help revolutionize his operations through analytics dashboards. The team created a custom-built dashboard which allowed them to quickly track key performance indicators (KPIs) like elf pastimes, resources used in the workshop, productivity levels at different times of day or night - even how much progress had been made against last year’s goals!
This change saved so much time for Sprinkle, Twinkle and Crinkle! With an easy-to-read dashboard providing all the information they needed up front, it was now easier than ever for them keep track of what they needed to do each day without having to search through spreadsheets or documents - plus they got more done faster too! Now that Honeycomb is in place throughout the workshop there are no worries about whether everything will be delivered on time this Christmas – thanks be to data analytics!


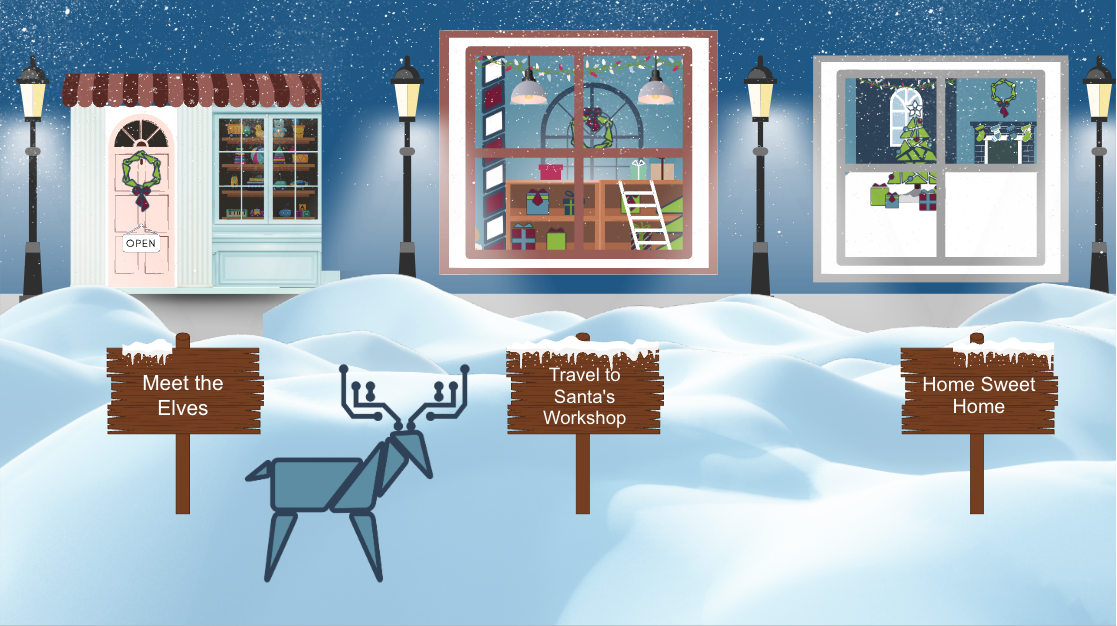
Click around on the dashboards to interact with the content!

Corporate Data in One Place
Operational data analysis is the backbone of efficient and effective business processes. It involves the continuous monitoring and examination of real-time data generated during day-to-day operations. This analysis helps organizations detect and resolve issues promptly, improve workflow efficiency, and enhance overall performance. By leveraging operational data analysis, businesses can optimize their processes, reduce costs, and ensure they are operating at their highest potential, ultimately leading to increased productivity and customer satisfaction.
Geographical Data Can Make a Drill Through Dashboard Powerful
Geospatial analysis is indispensable for businesses that rely on location-related data. It enables organizations to visualize, interpret, and draw insights from geographical information, helping in decision-making, resource allocation, and market understanding. By using maps, heatmaps, and spatial analytics, businesses can uncover spatial patterns, optimize logistics, and identify new opportunities for growth. Geospatial analysis is a powerful tool for making location-based decisions, enhancing efficiency, and gaining a competitive edge in today’s data-driven world.
Data Transformation
Data transformation plays a pivotal role in data analysis and business intelligence. It involves cleaning, structuring, and refining raw data to make it suitable for analysis. This process is essential as it ensures data accuracy and consistency, enabling reliable insights and decision-making. Without effective data transformation, the quality of analyses and visualizations can be compromised, emphasizing the critical importance of this step in the data analytics pipeline.
More Dashboards


We can do this for you too!

“Our collaboration with Moser Consulting proved to be transformative for our operations at the North Pole Inc. They delivered an exceptional data dashboard that revolutionized our gingerbread house ingredient ordering process. Leveraging this tool, we maintained a consistent supply of ingredients, preventing any late orders that could potentially stall our production. This not only ensured the timely delivery of gingerbread houses but also led to substantial cost savings. Moser Consulting’s expertise has undeniably set a new standard for efficiency and effectiveness in our operations.”
- Sprinkle, the Chief Executive Elf at the North Pole Inc.

“I can’t overstate the incredible time-saving transformation brought about by moving our Naughty and Nice list to a data dashboard. Unlike the old days of double-checking parchment scrolls, this dynamic tool allows us to categorize and track behavior patterns in real-time. With its intuitive and user-friendly interface, we can now update Santa Claus instantly on who’s been naughty or nice. The dashboard’s accuracy has eliminated the need for our traditional double-checking method, freeing up significant time for other essential elf duties. This new age Naughty and Nice list has genuinely ushered in an era of ‘Nice’ efficiency at the North Pole!”
- Periwinkle, the Chief Observation Elf at North Pole Inc.
Download our Holiday Dashboard Look Book
We can do this for you too!
Executive dashboards are crucial for providing high-level insights to senior management and decision-makers within an organization. They offer a concise and visually engaging way to present key performance indicators (KPIs) and critical metrics, allowing executives to quickly grasp the state of the business. These dashboards enable timely decision-making by highlighting trends, anomalies, and areas that require attention, ultimately leading to more informed and strategic choices for the organization’s success.
When you control your data, the picture becomes clear.
Get insights from your data through dashboards that pull disparate data sources to one tool.
In a world increasingly reliant on digital information, the ability to harness and interpret your data is a crucial aspect of maintaining a competitive edge. This is where Honeycomb Analytics comes in. We provide a comprehensive solution designed to centralize your data into a usable and reliable platform, providing analytics at your fingertips.
Learn more about Honeycomb and what it can do you!